Enter verified counts to build a review flow diagram. The builder checks the arithmetic and creates a two-column flow diagram like the example, including source names and counts.
Use verified review records. This builder uses the database/register pathway shown in the example. It checks count consistency but cannot validate your screening decisions. If your review also identifies studies through other methods, use the matching official PRISMA template. Entries stay in this browser.
01 · DATA ENTRY
Enter your counts
Enter zero where a category does not apply. Totals in the diagram are calculated automatically.
The page starts with an illustrative example. Replace it with your own verified counts. Work is saved in this browser only; export CSV or JSON before changing devices or browsers.
02 · LIVE PREVIEW
Flow diagram
Enter your verified counts to update the diagram.
PRISMA 2020-style draft based on the database/register pathway. Verify every count against the search log and screening record before reporting.
03 · LEARN FROM PUBLISHED REVIEWS
Six article examples
Choose an article to view a teaching reconstruction generated with this builder. The examples are read-only and will not replace your own counts. Check the source figure and notes, especially where the article reports inconsistent values.
REPORTED FLOW · COUNTS RECONCILE
Smart villages: A systematic review of trends, models, and metrics
Junaidi et al. (2025) · Cogent Social Sciences, 11(1), Article 2492833
Read with care: the article narrative reports 104 full texts assessed and 60 retained, so 44 exclusions are calculated for this builder diagram (104 − 60); the article does not report that 44 as a single count. Figure 1 instead shows 72 assessed, 32 excluded for no empirical evidence and 12 for insufficient methodology, which does not reconcile with the stated 60 included. Check the source PDF before citing these stages.
REPORTED COUNTS · GROUPED BY BUILDER STAGE
Machine translation performance for low-resource languages: A systematic literature review
Mapping note: the 571 records filtered before quality assessment are grouped in the builder’s title/abstract exclusion box because its input form does not represent every intermediate filter separately. The paper reports 108 duplicates, 359 outside the year range and 296 non-journal papers before this group; 200 reached quality assessment, 131 were excluded, and 69 remained.
ARITHMETIC RECONSTRUCTION · INFERRED GAP MARKED
A deployment-oriented framework for machine learning-based learning style identification: A systematic computational analysis
Adeyemo et al. (2026) · International Journal of Advanced Computer Science and Applications, 17(3), 564–576
Do not treat the inferred value as reported data: the paper reports 2,816 records and 671 duplicates, leaving 2,145; its figure says 671 records screened and lists 417 screening exclusions, which leads to 254 full texts. The builder therefore labels the unexplained 1,474-record gap as inferred, not reported to reproduce the figure’s later counts. The reported full-text exclusions (176 + 21 = 197) reconcile with 57 included.
DATABASE FLOW · OTHER-METHOD RECORDS SHOWN SEPARATELY
Deep learning and edge computing in agriculture: A comprehensive review of recent trends and innovations
Junaidi et al. (2025) · IEEE Access, 13, 137464–137490
Other-method note: this builder displays the 71 studies from the database flow. The article adds 4 studies through snowballing, giving 75 in the methods/results. Snowballing is not represented in this database/register-only builder. The article abstract also reports 76, so verify the final figure in the source PDF.
RECONSTRUCTION · REPORTING DISCREPANCIES TO AUDIT
A critical review of feature selection methods for machine learning in IoT security
Li, Othman, Chen, & Yusuf (2024) · International Journal of Communication Networks and Distributed Systems, 30(3), 264–312
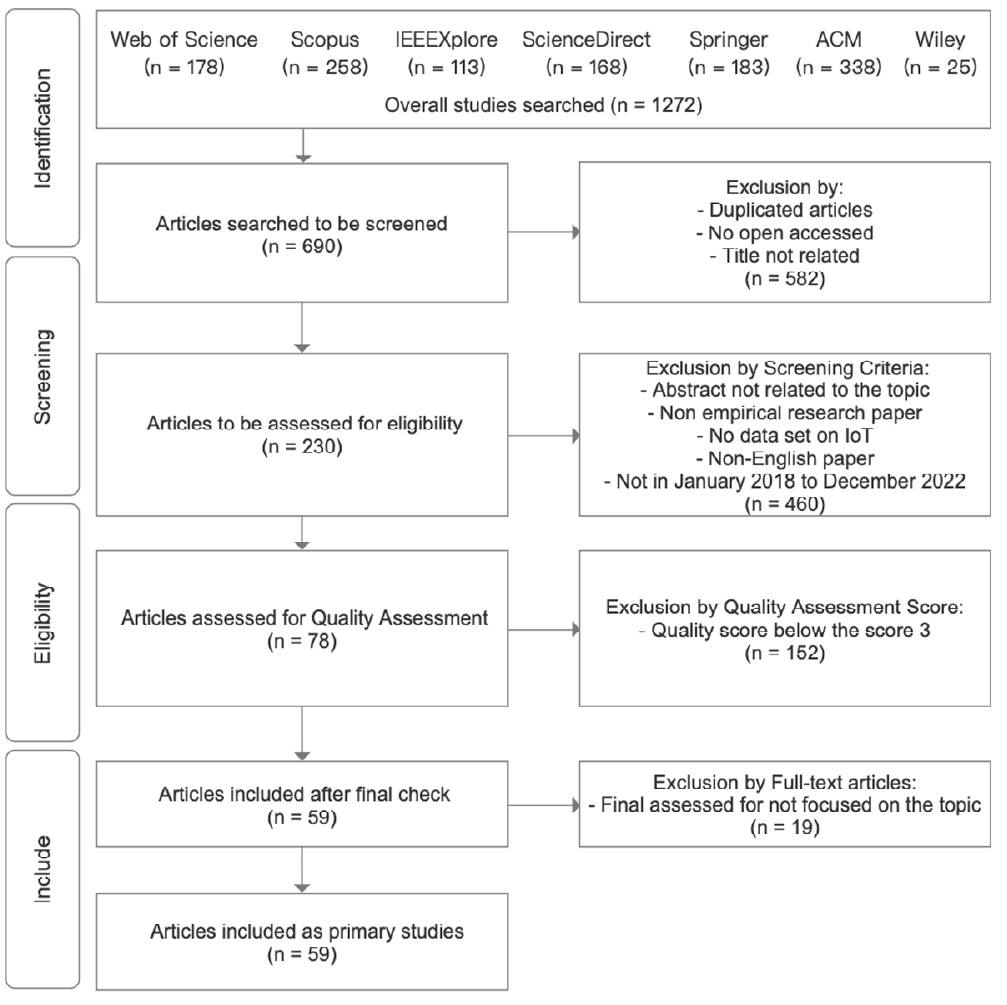
Audit the source before using these counts. Table 3 sums to 1,272 using Wiley = 34; Figure 2 shows Wiley = 25 while retaining 1,272 (the displayed source counts sum to 1,263). The reconstruction groups 582 pre-screening removals, then uses 460 screening exclusions, 152 QA-score exclusions and 19 final-topic exclusions to reproduce 59 included. Figure 2 labels 78 as assessed for quality assessment, while the abstract and results report 63 included studies. These reported figures do not form one unambiguous flow. Section 2.5 also says scores greater than 3 were included, while Figure 2 says scores below 3 were excluded. Treat the diagram above as a teaching reconstruction; do not present it as the article’s reported PRISMA figure.
Diagrams are generated from article counts using the same PRISMA Flow Diagram Builder above. They are teaching reconstructions, not replacements for the articles’ own figures or official PRISMA templates. Open each PDF to verify the source context.
Before you export
Reconcile source totals and duplicate removals with your database exports.
Check that screening exclusions, reports not retrieved and full-text exclusion reasons match your decision log.
Confirm the final number of included studies. Keep study counts separate from report counts.
Export the SVG for publication-quality editing, PNG for slides, or print to PDF. Keep a CSV/JSON backup of the entered data.